TMCx Company Profile: DiBS

Looking at an excel spreadsheet and trying to extract useful information and analytic conclusions can seem like an exercise in ocular torture. Rows and columns bleed together as your eyes are inundated with zeroes and ones, while distinctions between entirely separate categories become blurred. While the amount of health care data being collected is increasing exponentially, data analysis techniques are lagging behind—often, that information just sits dormant in large databases, collecting dust without a way for users to interact with it.
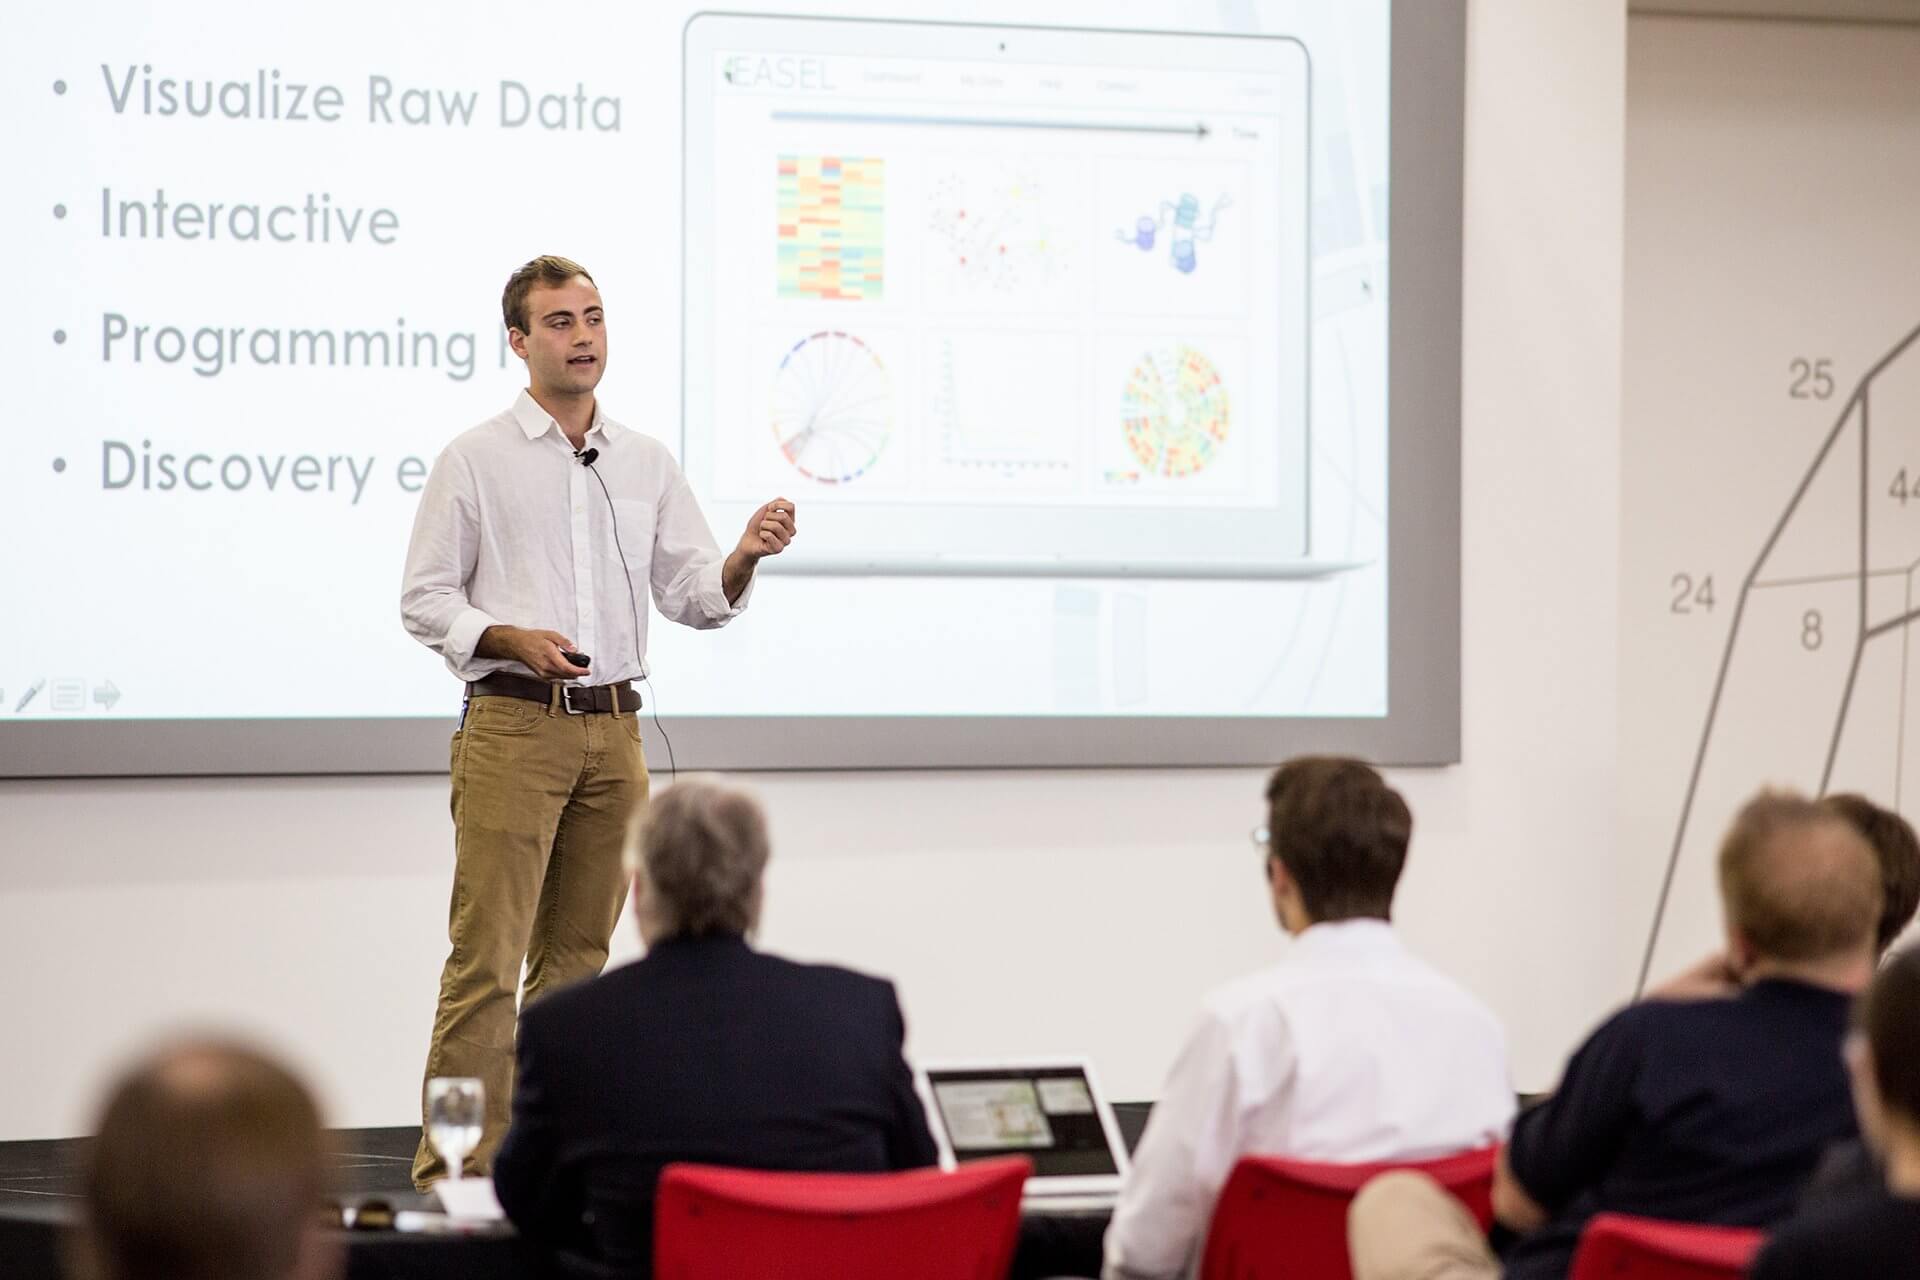
“Current big data platforms require coding or complex user interfaces to build static visualizations,” said Alex Bisberg, co-founder of Data is Beautiful Solutions (DiBS), a company seeking to empower users through interactive data visualization. “Our new software, EASEL, gives users the power to create informative, interactive visualizations with just a few clicks. We want you to be able to identify what’s the best way to look at your data, and avoid as many complex interfaces as possible in the process. ”
“EASEL helps you communicate your data rapidly with collaborators and colleagues,” affirmed Wendy Hu, co-founder of DiBS. “That allows them to identify both new individual and crowd-based insights through our advanced algorithms. Providing a quick, easy-to-use interface to these huge data stores can lead to new discoveries—by interacting with data through EASEL, doctors can better determine which therapies to give specific patients to improve their health.”
Imagine you’re a bioinformatics specialist sifting through a spreadsheet containing a massive data set—one that involves fitness statistics across a specific population, for example—and questions about that set begin bubbling to the surface. Is there a correlation between zip code and overall fitness level? Does the number of miles ran correspond to protein intake and weight gain? By plugging that information into EASEL, vibrant and crisp visualizations spring to life—realized through color-coded wheels and graphs popping with primary splashes of red, green and yellow—making it easy to distill useful conclusions.
“Phrases we have heard repetitively by both friends and competitors are ‘elegant design’ and ‘easy to use,’” noted Amina Qutub, Ph.D., co-founder of DiBS and an assistant professor of bioengineering at Rice University. “We have, thankfully, acknowledged this. Competitors have pointed out some challenges we could face in the future, such as connecting to multiple data sources and synthesizing with existing software platforms. We are currently facing these challenges head-on by working with leading industry partners.”
Qutub, along with co-founders Bisberg, who recently completed his undergraduate degree at Rice, and Hu, a doctoral candidate in Qutub’s lab, came together during last year’s DREAM challenge—an online, crowd-sourced challenge to the systems biology community. Unified by their passion to build a better way to visualize and analyze biomedical data, the team’s bright vision for the future is being cast into stark relief.
“DiBS is becoming a pioneer in developing enterprise solutions for hospitals as a way to allow doctors and researchers to quickly analyze their data and collaborate with their colleagues,” said Bisberg. “It makes it possible for anyone from any specialty—from a bioinformatics researcher, to a doctor, to a health policy expert—to communicate in the same language. Our software tools will help health care professionals make new discoveries, speed up their workflow, and improve patient care.”
“Further down the road, we hope to expand beyond the hospital setting,” he added. “Other industries that face data problems that EASEL can help solve include oil and gas, marketing, and smart building management. We plan to capitalize on these industries in the future.”


